A person can have good visual acuity and still have difficulty detecting the low-contrast edges and surface changes that matter during everyday mobility.
That distinction is one reason the Physiological Profile Assessment (PPA) developed by Lord and colleagues does not use conventional high-contrast visual acuity for its vision component. Instead, the abbreviated PPA assesses edge-contrast sensitivity, alongside lower-limb proprioception, knee extension strength, reaction time and postural sway.[1]
For clinicians assessing physiological contributors to falls risk, contrast sensitivity therefore provides information that a Snellen or logMAR chart alone cannot.
The challenge is that measuring it traditionally requires dedicated test materials and reasonably consistent administration. That is also where a digital approach can make the test considerably easier to incorporate into a routine assessment.
Visual acuity and contrast sensitivity measure different things
Visual acuity primarily measures spatial resolution: how small a high-contrast target a person can identify.
Contrast sensitivity asks a different question: how much contrast is required before an edge or object can be distinguished from its background?
That distinction has practical relevance to mobility. Environmental features such as step edges, kerbs, changes in floor surface and shallow obstacles are not necessarily represented by small, sharply defined, high-contrast targets. Their visibility may instead depend on relatively subtle differences in luminance.
Contrast sensitivity can also reveal visual impairment that is not adequately represented by visual acuity. In normative work using the Melbourne Edge Test (MET), Eperjesi and colleagues found that reductions in contrast sensitivity associated with visual impairment could not be explained entirely by reductions in visual acuity.[2]
The two measures should therefore be considered complementary rather than interchangeable.
Why contrast sensitivity is included in falls assessment
Visual impairment is one of several factors associated with falls in older adults, and research has examined a range of visual functions including acuity, visual fields, depth perception and contrast sensitivity.
In a prospective study, Lord, Clark and Webster assessed visual acuity and contrast sensitivity in older adults and followed participants for falls over the subsequent year. Contrast sensitivity differed between those who subsequently fell and those who did not. Visual impairment was also associated with greater postural sway when participants stood on a compliant surface, where reliable sensory information from the support surface was reduced.[3]
A later prospective study by Lord and Dayhew examined several dimensions of vision in 156 community-dwelling adults aged 63–90 years. Multiple fallers performed more poorly across the visual measures, with depth perception, contrast sensitivity and low-contrast visual acuity among the strongest visual risk factors.[4]
Importantly, contrast sensitivity should not be interpreted as a stand-alone predictor of whether someone will fall.
Contrast sensitivity should not be interpreted as a stand-alone predictor of whether someone will fall. That is precisely the logic of the PPA — rather than attributing falls risk to a single deficit, it measures several physiological domains that contribute to balance and mobility.
The Melbourne Edge Test
The original PPA assesses contrast sensitivity using the Melbourne Edge Test.
Rather than asking the participant to identify letters, the MET presents circular stimuli containing an edge produced by two regions of differing luminance. The participant identifies the orientation of the edge as its contrast progressively decreases.
Performance is expressed in decibels (dB), with higher scores indicating better contrast sensitivity.
The method has some useful characteristics for physiological assessment. It is a forced-choice task, does not depend on recognising progressively smaller letters and produces a quantitative measure that can be recorded alongside the other components of the PPA.
There is also published age-related reference data for MET performance.
Eperjesi and colleagues assessed 168 adults with normal vision aged 18–93 years. Contrast sensitivity was relatively stable until approximately 50 years of age, with a reported mean of 23.8 ± 0.7 dB, before declining by approximately 1.5 dB per decade.[2]
Age therefore matters when putting an individual result into context.
The practical problem with physical contrast-sensitivity testing
The traditional test works, but it requires a physical set of test stimuli and a consistent testing procedure.
The test needs to be available when required, the appropriate stimulus sequence needs to be followed and the result needs to be scored and recorded. Illumination also matters: contrast testing is inherently dependent on visual presentation conditions, so substantial differences in ambient lighting can affect the testing environment.
None of these requirements is particularly onerous. Collectively, however, they make contrast sensitivity less convenient to incorporate into a routine assessment than measures that can be performed with equipment already at hand.
This is particularly noticeable if contrast sensitivity is only one component of a larger physiological assessment.
Putting the edge-contrast test on an iPad
Contrast Sensitivity, part of our Neuro Tools suite, is designed to make this component of the assessment easier to perform without changing the fundamental task.
Instead of maintaining a separate set of physical edge-contrast stimuli, the test is presented on an iPad.
The participant identifies the orientation of a circular edge stimulus and the app progressively reduces the contrast through a defined staircase sequence. Screen brightness is standardised for the duration of the test and automatically returned to the user’s previous setting afterwards.
The app handles stimulus progression and scoring automatically, producing a final contrast-sensitivity result in dB.
For the person administering the test, the workflow is deliberately simple:
- open the test on the iPad;
- complete a short practice sequence;
- have the participant identify the edge orientation as contrast decreases; and
- record the resulting dB score.
There is no printed scoring key to follow and no manual calculation at the end.
Giving a dB result some context
A contrast-sensitivity score is only useful if the person interpreting it understands what the number represents.
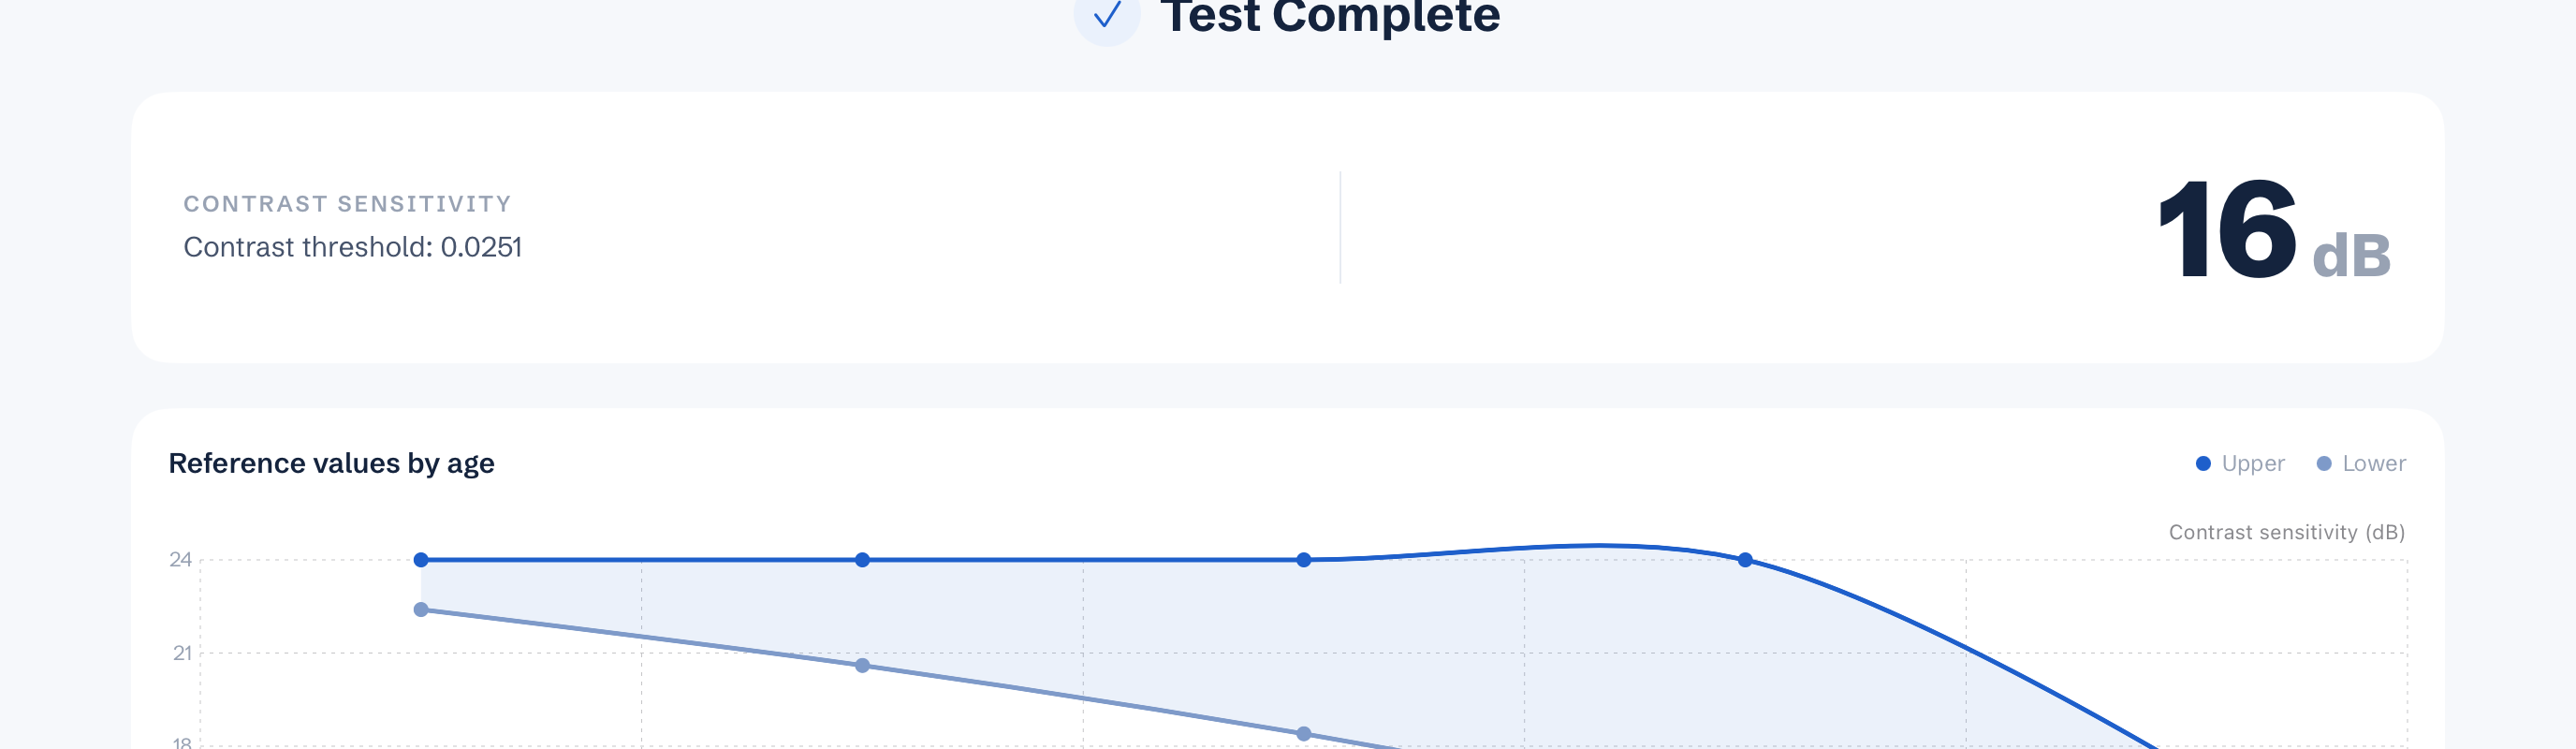
For that reason, the Contrast Sensitivity app displays the final dB result together with an age-related reference graph based on published Melbourne Edge Test normative data.[2]
The graph is intentionally separate from the individual’s result. It provides context for the expected age-related change in contrast sensitivity without automatically classifying the person’s performance.
The app does not generate a percentile, label a result normal or abnormal, or calculate falls risk from the contrast-sensitivity score.
That distinction is deliberate.
The app performs the measurement and provides the relevant reference information. Interpretation remains with the clinician, who can consider the result alongside the person’s age, visual status, testing conditions and other assessment findings.
Designed to sit alongside the other PPA domains
The greatest value of contrast-sensitivity testing in this setting is not as an isolated visual test, but as one part of a broader physiological profile.
A person may have relatively preserved strength but impaired contrast sensitivity. Another may have good visual performance but slower reaction time or increased postural sway. The resulting profiles can look very different even when overall falls risk appears similar.
Using a digital edge-contrast test makes the vision component easier to include rather than omit simply because the physical test materials are not readily available.
Where it is being incorporated into a PPA-style assessment, administration should still be standardised as far as practicable. Viewing distance and ambient illumination should be kept reasonably consistent, and the participant should use their appropriate habitual visual correction. The practice sequence can be used to confirm that they understand the orientation task before scored testing begins.
A simpler way to measure a useful part of visual function
Contrast sensitivity does not replace visual acuity, and neither measure provides a complete assessment of vision.
What edge-contrast testing adds is a measure of the ability to distinguish progressively less visible boundaries — a dimension of visual function with particular relevance to the PPA and to the visual demands of mobility.
The Contrast Sensitivity app takes that established testing principle and makes it practical to perform on hardware already found in many clinical settings: an iPad.
Stimulus presentation, brightness control, progression and scoring are handled by the app. The result is provided in dB, with published age-related MET reference data available on the same screen for context.
That leaves the clinician with the part that should not be automated: deciding what the result means alongside the rest of the examination.
Learn more about Contrast Sensitivity →
References
-
Lord SR, Menz HB, Tiedemann A. A Physiological Profile Approach to Falls Risk Assessment and Prevention. Physical Therapy. 2003;83(3):237–252. doi:10.1093/ptj/83.3.237
-
Eperjesi F, Wolffsohn JS, Bowden J, Napper G, Rubinstein M. Normative contrast sensitivity values for the back-lit Melbourne Edge Test and the effect of visual impairment. Ophthalmic and Physiological Optics. 2004;24(6):600–606. doi:10.1111/j.1475-1313.2004.00248.x
-
Lord SR, Clark RD, Webster IW. Visual acuity and contrast sensitivity in relation to falls in an elderly population. Age and Ageing. 1991;20(3):175–181. doi:10.1093/ageing/20.3.175
-
Lord SR, Dayhew J. Visual risk factors for falls in older people. Journal of the American Geriatrics Society. 2001;49(5):508–515. doi:10.1046/j.1532-5415.2001.49107.x
This article is general clinical education and isn't a substitute for formal training or guidelines. Always interpret bedside tests in the context of the full examination, and as one component of a comprehensive falls-risk assessment.